The state’s higher education system, which this case study focuses on, is comprised of over 15 public community college and university campuses and contributes to the creation of knowledge and economic growth by providing affordable, innovative and rigorous programs to a broad cross section of students. This higher education system was preparing to transition its multiple community college locations to a unified “single college.” This transition, coupled with other strategic initiatives, helped identify the critical need to align extensive financial and operational data with the overarching mission of the system.
Challenge
As is often the case with many higher education institutions, the system was struggling with insufficient funding to make the critical investments its students need to thrive. With limited financial flexibility, coupled with a large-scale organizational transition to one college, it was becoming increasingly important for system leadership to have insight into the full cost and revenue dynamics of its institution. This visibility was key in not only understanding the financial performance of its offerings, but also how courses, programs and other organizational outputs consume the institution’s resources.
The objective of this initiative was not only to understand the complete cost and revenue picture, but also align current performance to the institution’s strategic priorities. At a tactical level, this means understanding the “drivers” of cost at the institutions, identifying programs that generate the most (and least) revenue, recognizing how resources are being allocated, and determining how to reallocate resources where needed.
The Process
The system leadership has been committed to establishing a robust Cost and Revenue Analytics program—not just at a single college or university—but across the entire system of colleges and universities. The model development process started at the community college level, but the high-level implementation approach for the community colleges and universities were comparable.
The overall approach required collecting several disparate data sets from both the financial (e.g., general ledger, payroll, assets) and operational (e.g., enrollment) sides of the house. The data then had to be processed, cleansed, and linked to be leveraged in the development of model allocation rules. Once the data was staged and cleansed, it was pulled into Pilbara Insights Software, a costing tool commonly used for financial and operational analysis at higher education institutions.
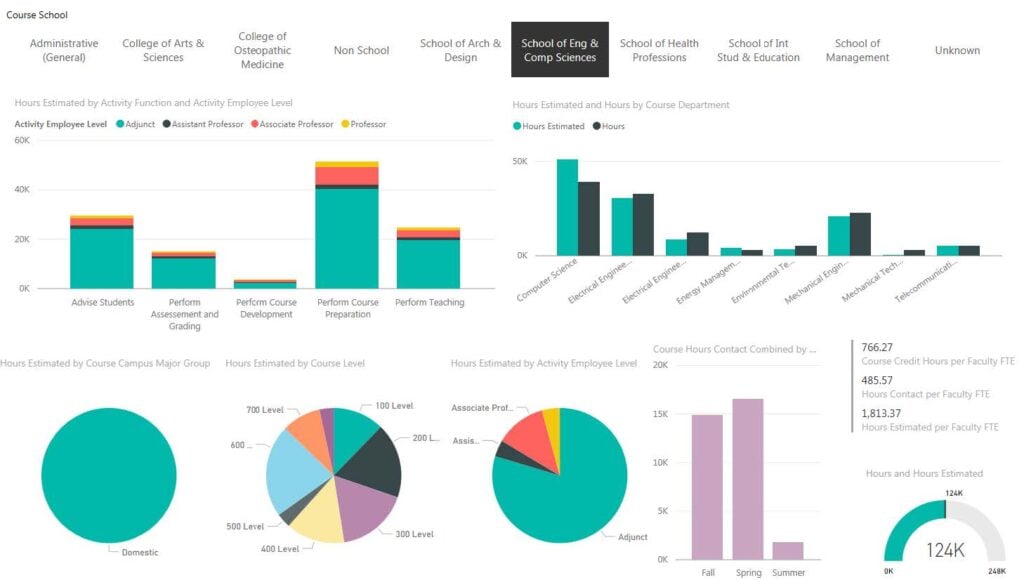
After the model was built, a slew of dynamic dashboards were developed in Power BI using model output data. The completed model, along with powerful reporting capabilities, provided the system with the ability to conduct a full course- and program-level costing analysis. Specifically, leadership was able to drill down to a specific course and program and identify the cost (direct and indirect), revenue (tuition and state appropriation), margin, cost per credit hour, and headcount associated with each. The model also included information on facility and space usage (which translated into the Power BI reports). The reports also provided a number of filtering options, including department, instruction mode, major, course type and fiscal year. The flexibility of the developed reporting capability allowed system leadership to compare the performance of courses, programs, departments, etc., at a single university or benchmark a particular offering across colleges/universities. The insights provided by the cost and revenue analytics model enabled the system to employ data-driven decision making and adjust resource allocation based on quantitative results.
As an additional benefit for the community college implementation, the model incorporated both their current-view and future-state (one college) organizational view. At the time of initial implementation, the system was in the process of transitioning its distinct campuses into one unified college. The system requested the incorporation of both structural hierarchies into their model, allowing leadership to view modeling results in both forms. In addition, this modeling approach allowed for benchmarking a single academic major (e.g., Business) across each of the campus locations.
System leadership now has a more complete understanding of how the institution is currently spending its resources, the value it receives for those expenditures, and what opportunities it has regarding expanding, reallocating or refocusing its resources in support of its mission and strategic plan.


